Sec.1-Ch.2-Subsec.4:Managing R Projects in RStudio and Visualizing Data with ggplot2 & gganimate
A hands-on guide to project management, static plots, and animated data storytelling in R

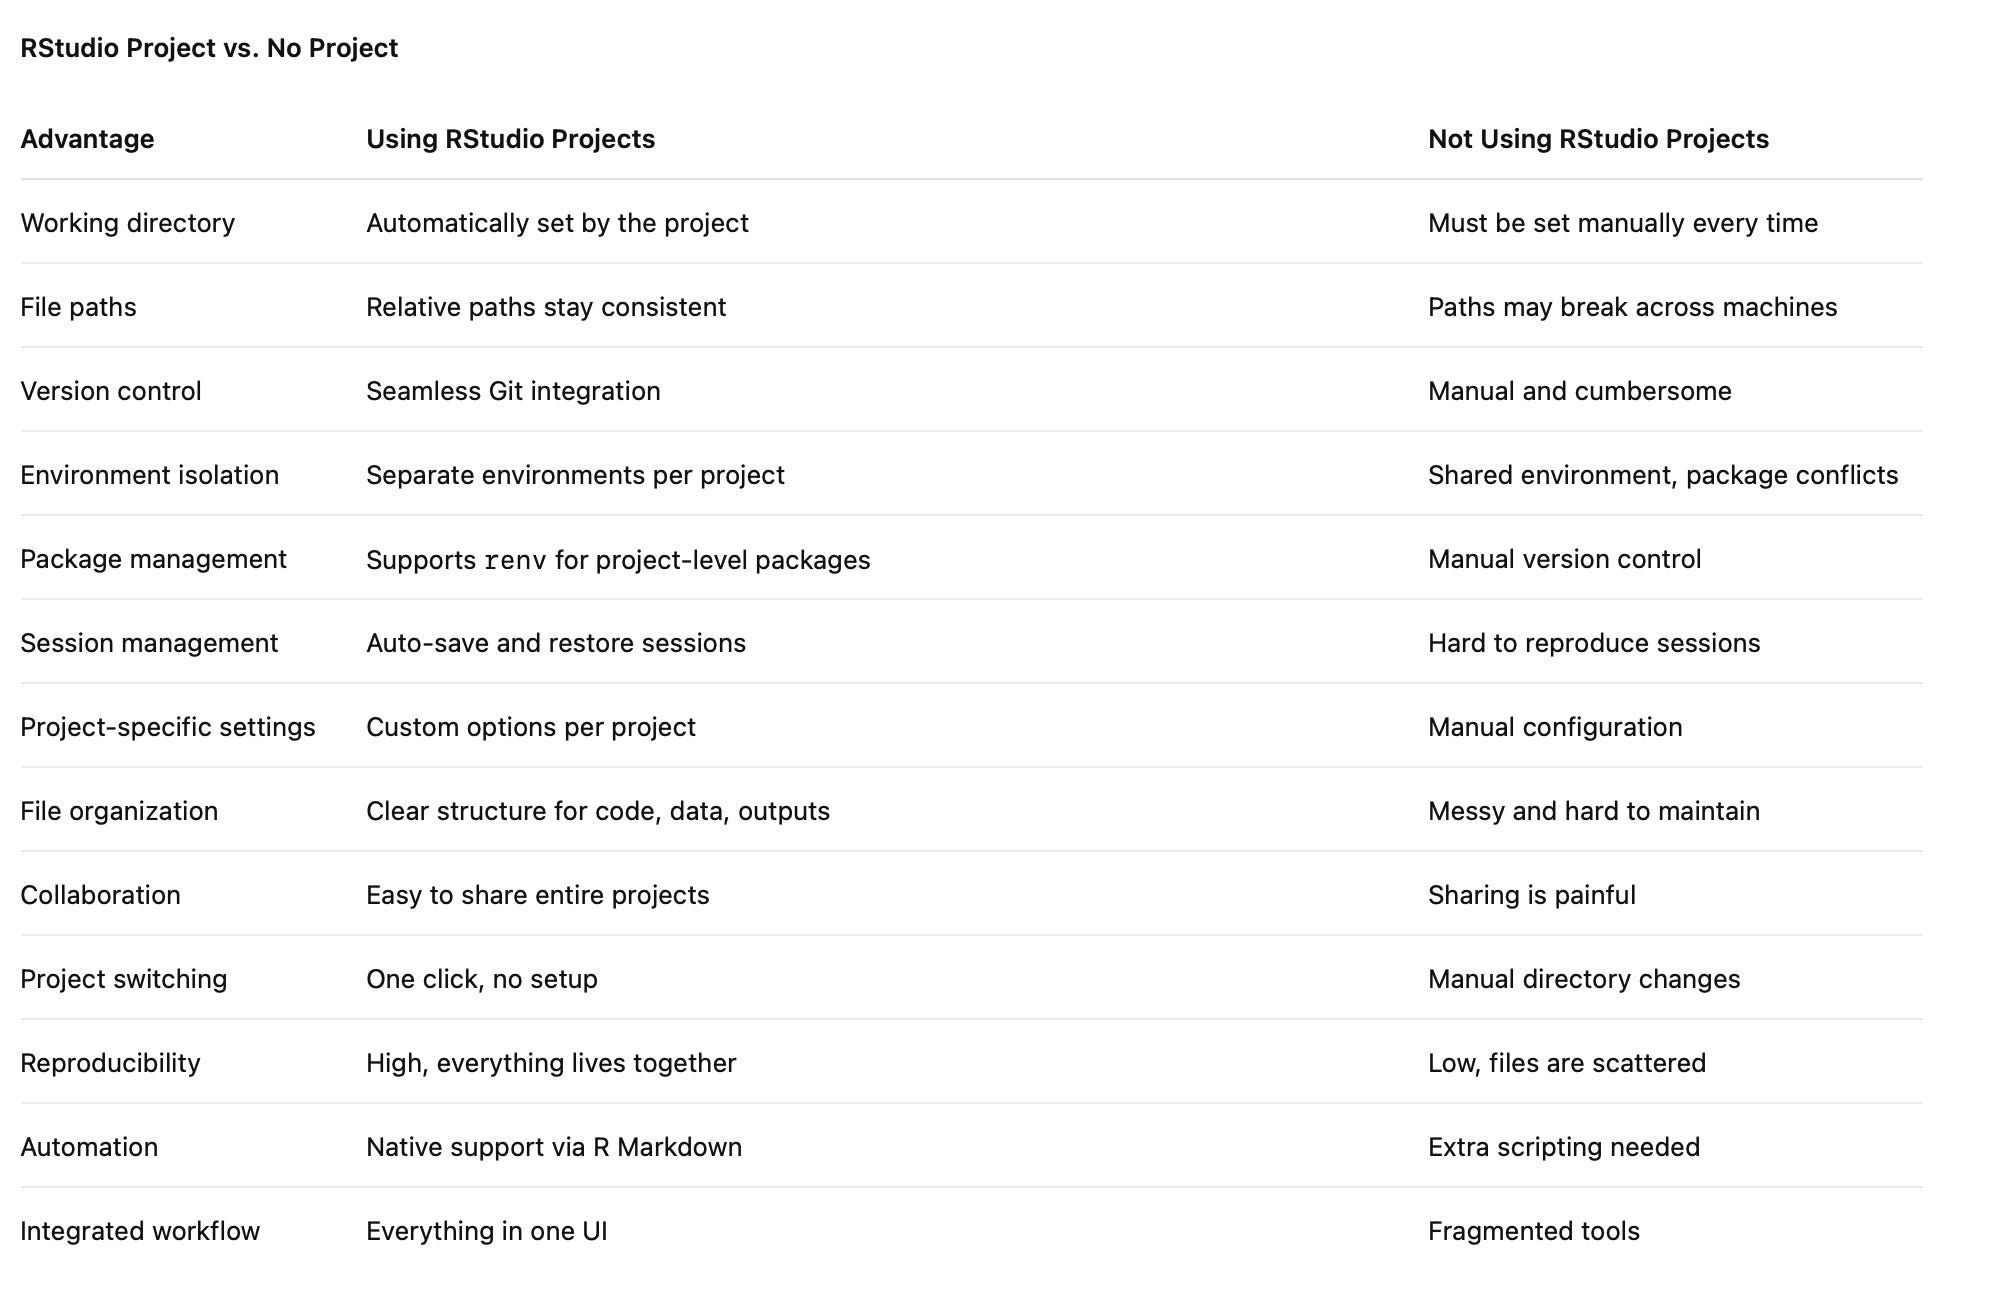
RStudio is a powerful Integrated Development Environment (IDE) for R. It’s not just a place to write and run R code — it also comes with built-in project management features. These features help you organize code, data, scripts, figures, and other resources in a clean, modular, and maintainable way.
1. Managing Projects with RStudio
RStudio is one of the most popular IDEs among data scientists, statisticians, and analysts — mainly because it’s both powerful and easy to use. Beyond coding and execution, RStudio provides solid project management tools that make data analysis workflows much more organized.
In this section, we’ll walk through:
Creating and structuring RStudio projects
File organization
Version control
Collaboration
Automated workflows
1. Creating an RStudio Project
An RStudio Project is essentially a workspace that keeps all your files and settings together. Each project has its own:
Working directory
Files
Environment settings
Think of it as a self-contained sandbox for your analysis.